Other Analytics
Analytics and data exports are also available on various pages throughout the application on top of the primary Analytics section.
Service Catalog
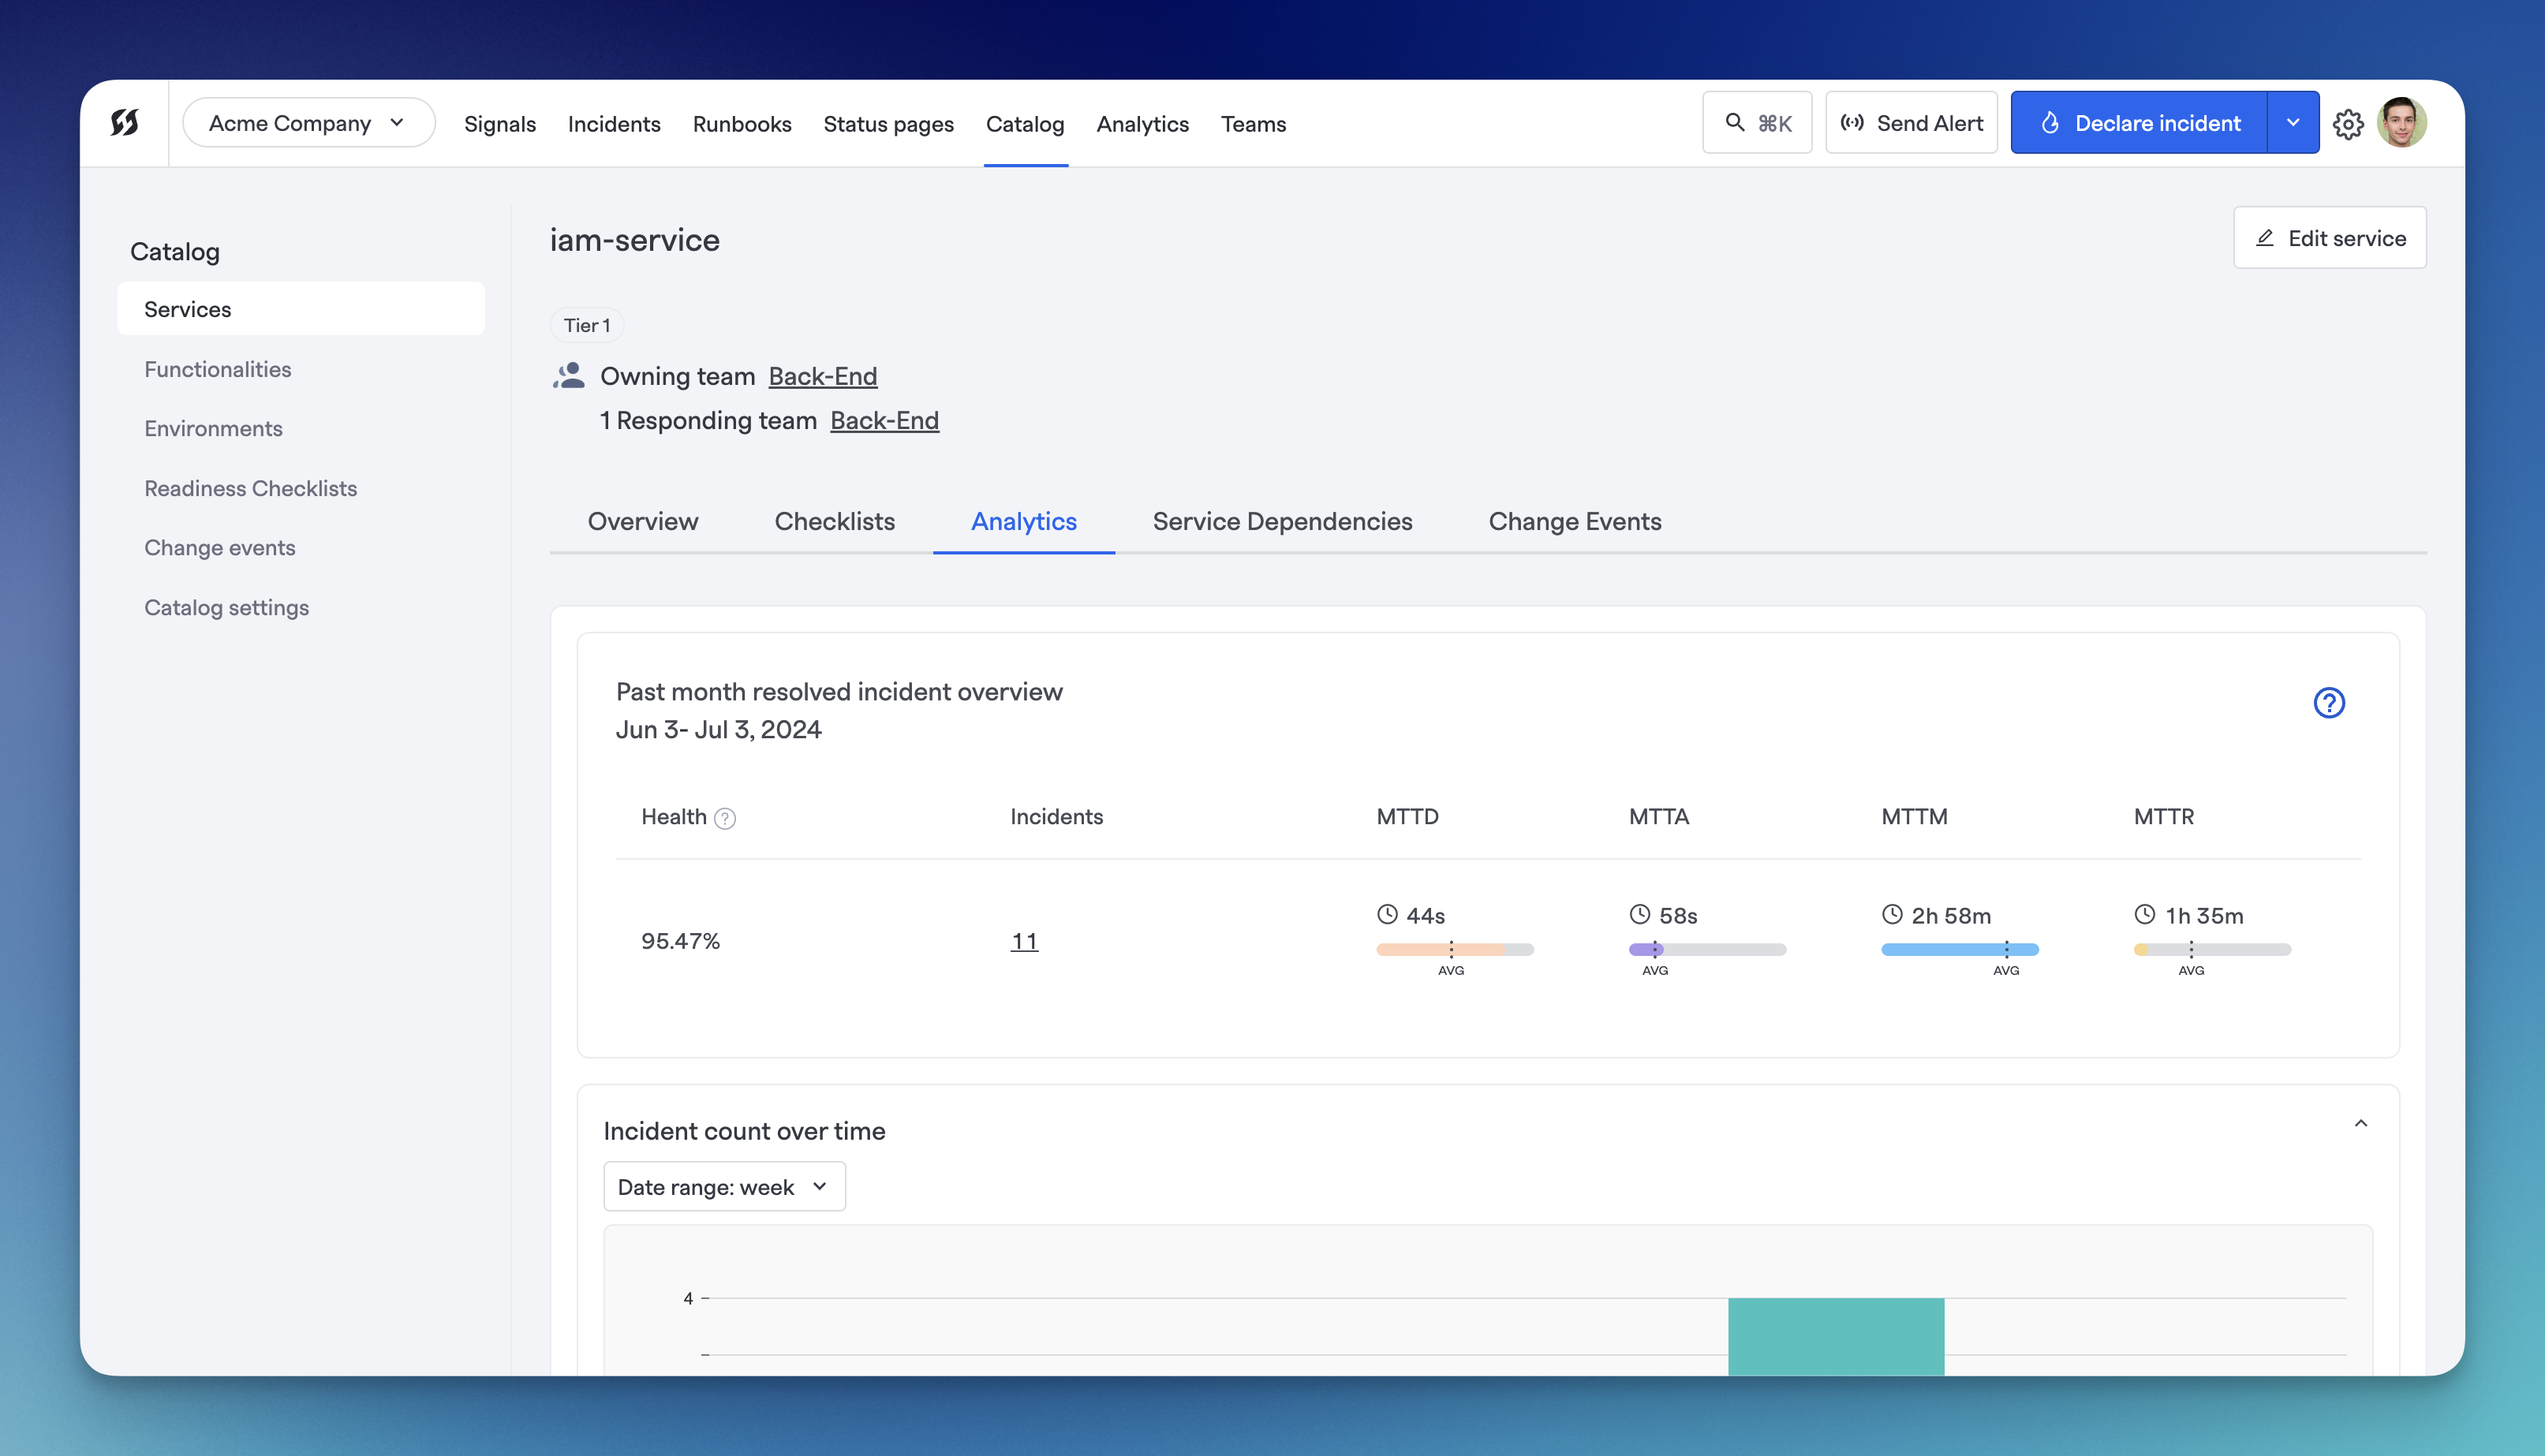
Analytics embedded into each Component's page
On the page for each component in the Service Catalog, there is an Analytics tab you can navigate to which will display the same charts as the MTTx Analytics, but with data for that specific component only.
This is available on Service, Functionalities, and Environments pages. For more information about the specific charts provided, visit MTTx Analytics.
Teams
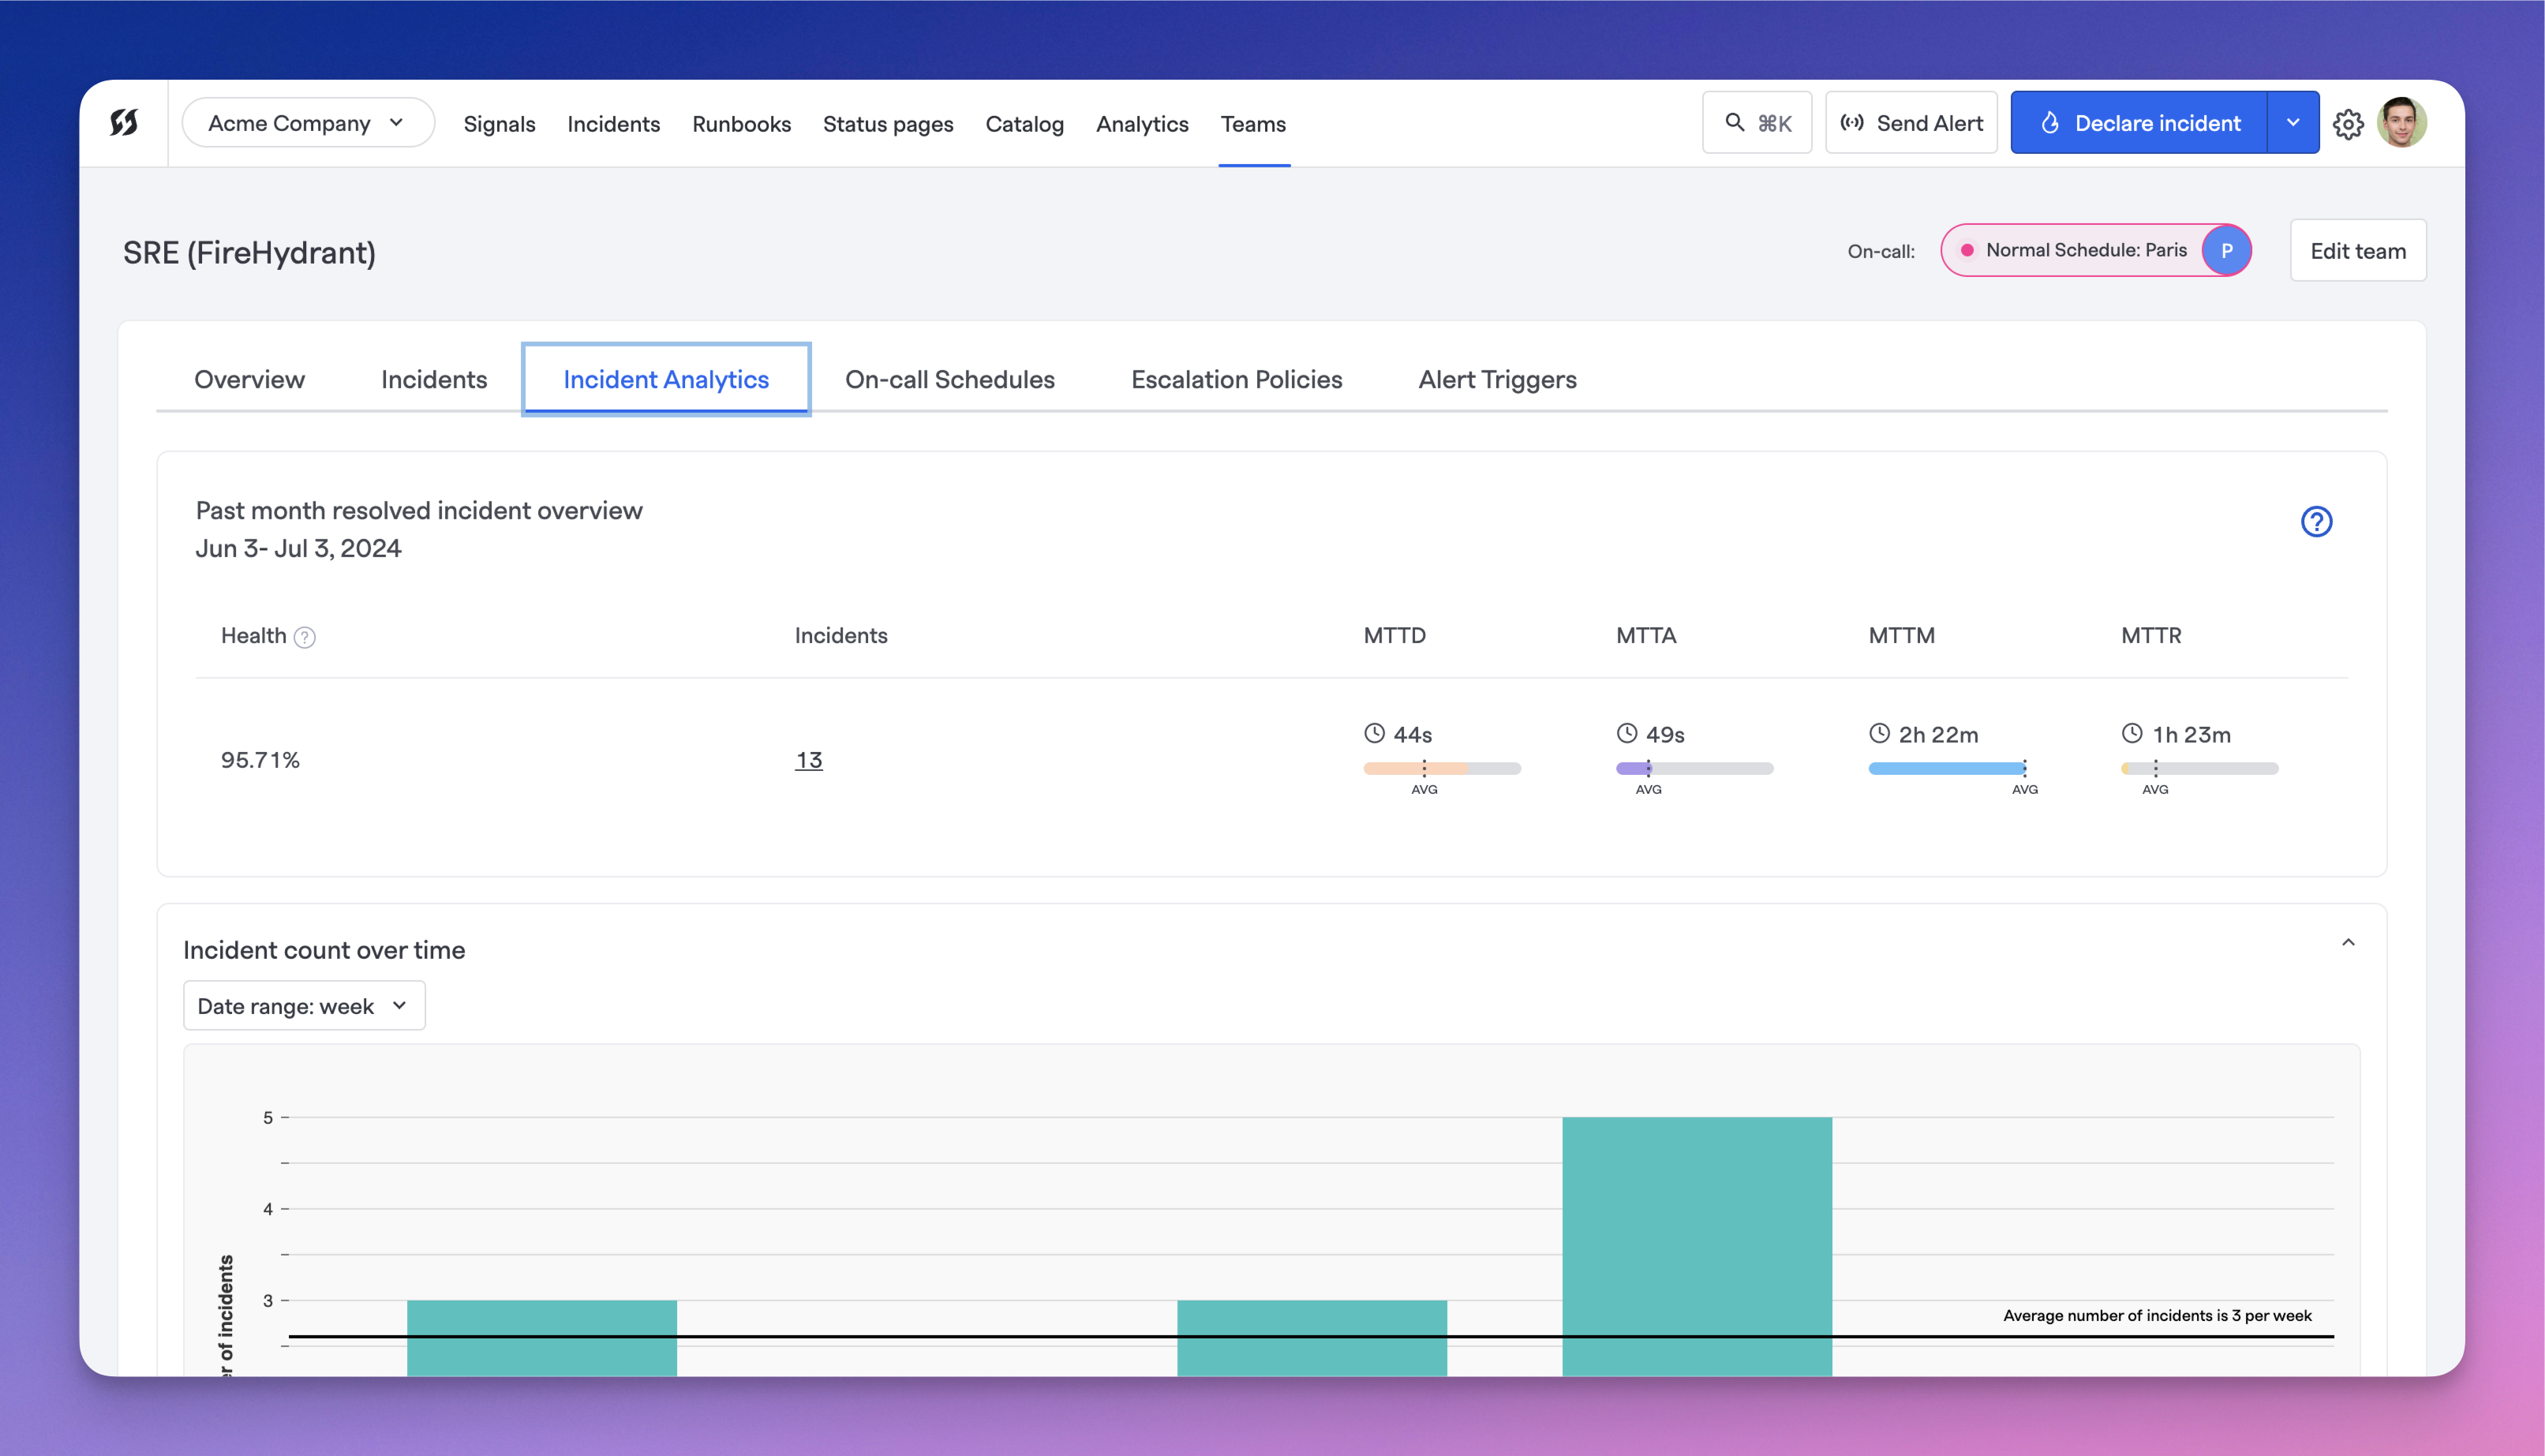
Analytics embedded into each Team's page
Likewise, Teams also have an analytics tab embedded into their respective pages. This shows data pared down to that specific Team (e.g., any incidents where this Team was assigned).
For more information, visit MTTx Analytics.
On-Call Hours
Teams also have an On-Call Hours tab that displays analytics related to on-call coverage and responder time. This section provides insights into:
- Total on-call hours - Cumulative hours spent on-call by team members
- On-call hours by person - Breakdown of on-call coverage by individual responder
- Schedule utilization - How often schedules were active and who was actively on-call during incidents
- Coverage metrics - Analysis of schedule coverage over time, including gaps and overlaps
On-Call Hours analytics help teams:
- Track on-call burden fairly across team members
- Identify coverage gaps or over-reliance on specific individuals
- Plan rotations and scheduling adjustments based on data
- Calculate on-call time for compensation or workload planning purposes
Updated 3 months ago