Grafana Event Source
The Grafana Integration for Signals allows users to create events in FireHydrant from Alerts in Grafana. Whenever Grafana sends an event to FireHydrant, we’ll evaluate the event to see if it matches a rule one of your teams set up. If a rule matches, we’ll alert the team. Learn more about Alert Rules here.
Configuring Grafana Webhook
- In FireHydrant, navigate to the Signals Sources page (Signals > Sources). Here, you’ll find a webhook URL you will use when creating a webhook in Grafana.

Copy the Grafana URL
- In Grafana, navigate to the Alerting page in the menu at Alerts & IRM > Alerting . Under the Alerting heading on the left, find the “Contact Points” page and go to it.
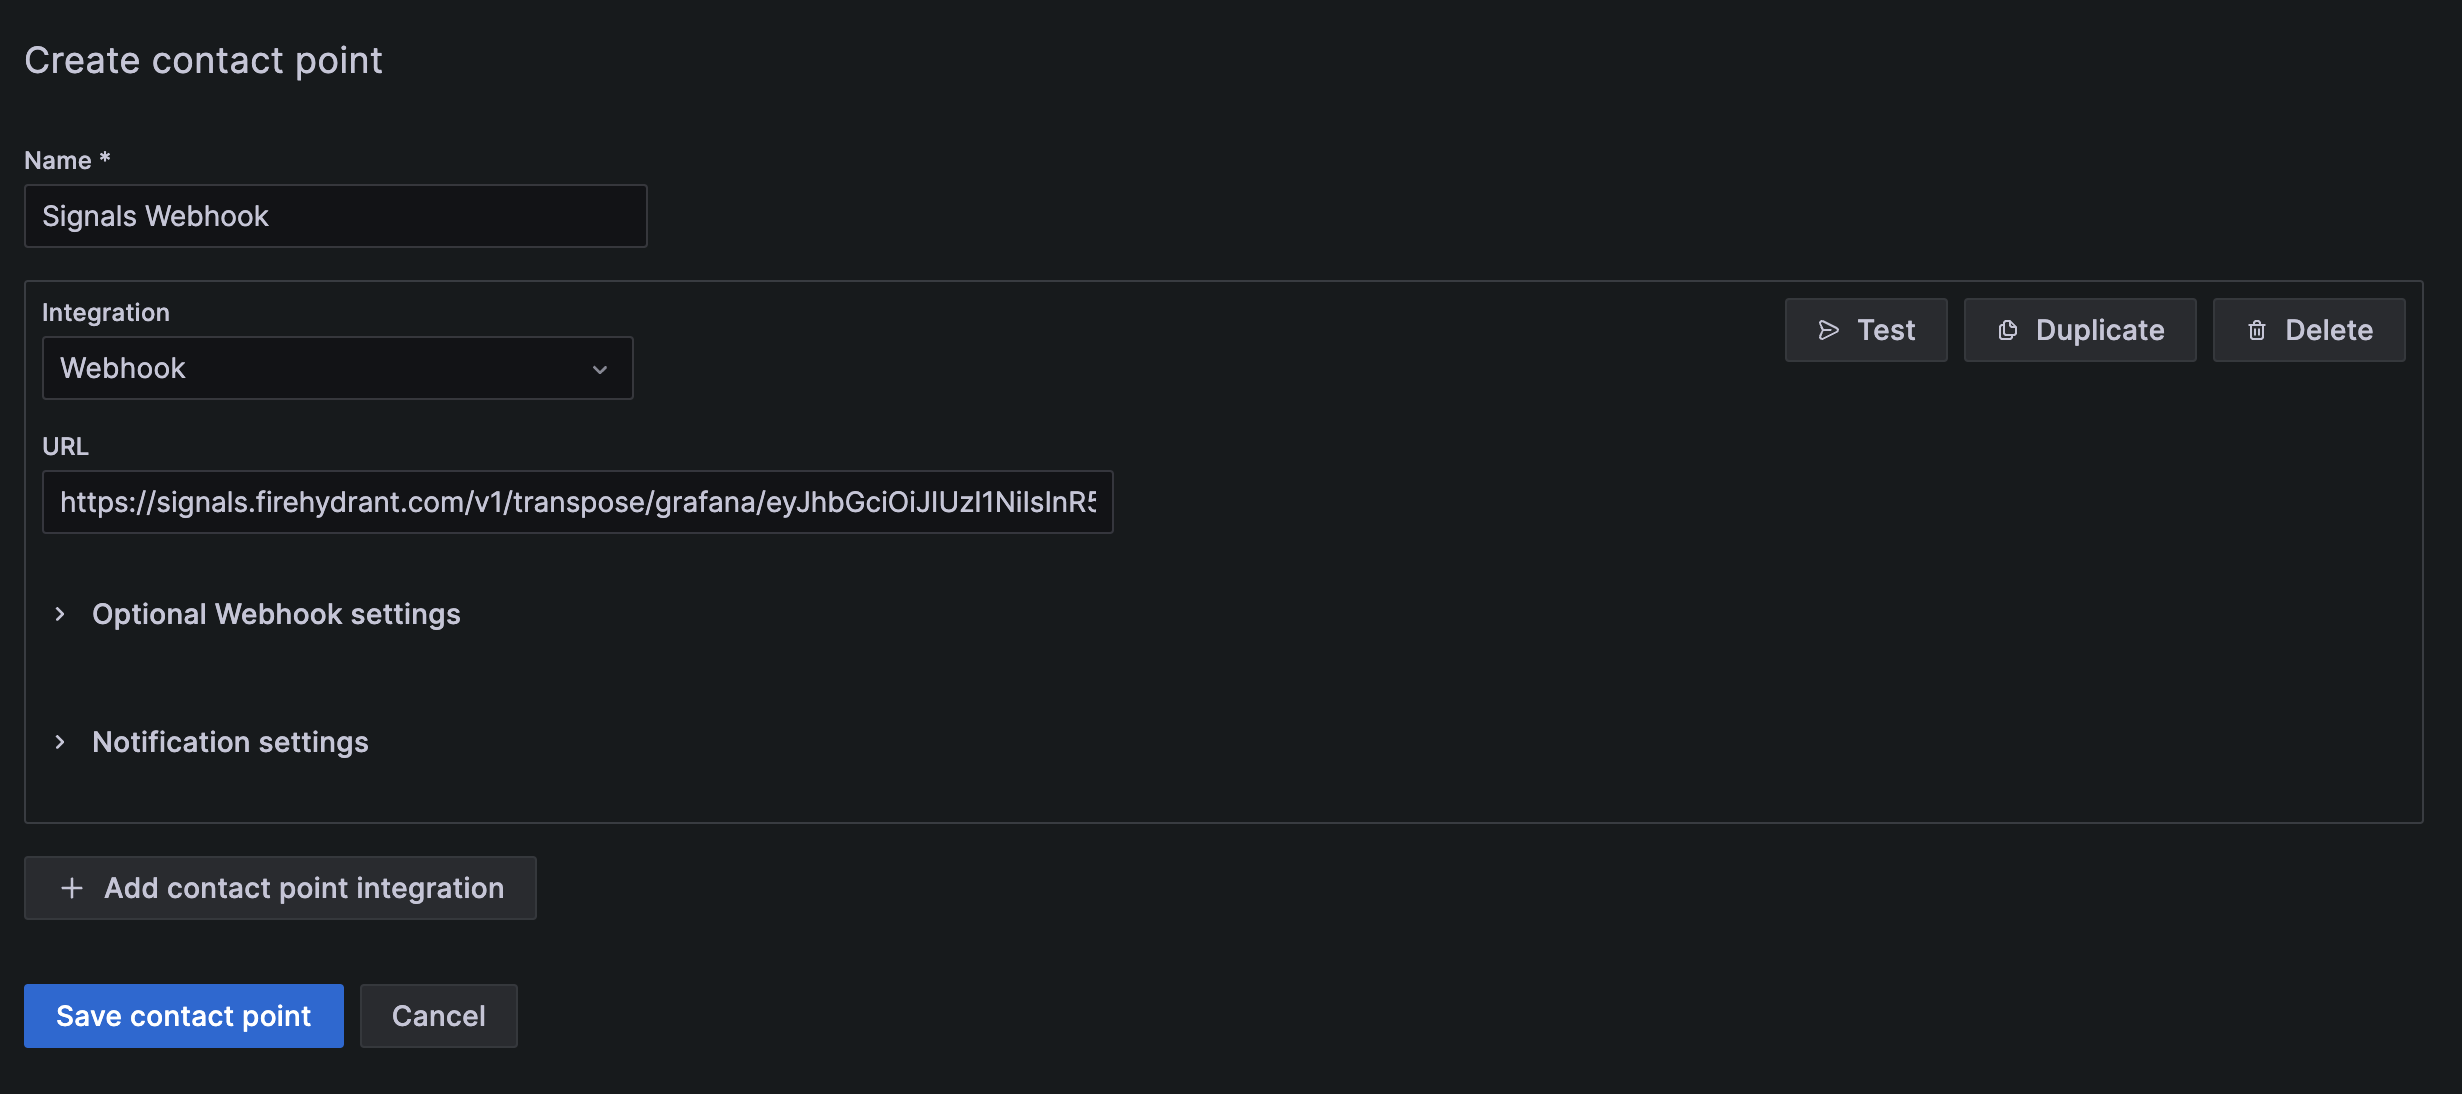
- Click the Add Contact Point button to create a new contact point. Add a name that will make it easy to find this contact later, and then choose the Webhook option under Integration. In the URL field, add the webhook URL from FireHydrant to the URL field.

Add the webhook to Grafana
Note:🔊 At this point, you can test the webhook to see it creating a Signal in FireHydrant from Grafana. We’ll go over the testing the webhook below.
- Click Save Contact Point to create your new webhook contact.
Testing your Grafana Webhook
- Grafana allows you to send a test notification when creating or editing a Contact Point. In the create/edit interface, click the Test button in the upper right corner of the form.
- Confirm that FireHydrant received your webhook by visiting Alerting > Webhook Logs in the web app. You should see a new event created. You can open the drawer to see the full payload from Grafana.
Adding Webhook to a Notification Policy
In Grafana, you can either set a default Notification Policy or create a nested notification policy to send specific alerts from Grafana to FireHydrant.
-
To create Signals from your default notification policy, click "More" next to the “New child policy” button and choose “Edit.”
-
Set your Signals webhook as the Default Contact Point.
-
Click “Save Policy”
To create Signals from specific alerts in Grafana:
- Click the “New child policy” button and choose the matching labels that make sense for the alerts you want to send to FireHydrant.
- Add your Signals webhook as the contact point for this policy. You can configure any additional settings for the policy that match your team’s needs.
- Click “Save Policy”
Field Mappings/Behaviors
The payload from Grafana will be directly mapped to FireHydrant's Events Data Model. The following table explains the behavior once the payload hits our system:
Inbound Parameter | FireHydrant Parameter |
|---|---|
|
|
|
|
|
|
|
|
|
|
|
|
|
|
These mappings mean that an inbound webhook from Grafana with the following content:
{
  "receiver": "My Super Webhook",
  "status": "firing",
  "orgId": 1,
  "alerts": [
    {
      "status": "firing",
      "labels": {
        "alertname": "High memory usage",
        "team": "blue",
        "zone": "us-1"
      },
      "annotations": {
        "description": "The system has high memory usage",
        "runbook_url": "https://myrunbook.com/runbook/1234",
        "summary": "This alert was triggered for zone us-1"
      },
      "startsAt": "2021-10-12T09:51:03.157076+02:00",
      "endsAt": "0001-01-01T00:00:00Z",
      "generatorURL": "https://play.grafana.org/alerting/1afz29v7z/edit",
      "fingerprint": "c6eadffa33fcdf37",
      "silenceURL": "https://play.grafana.org/alerting/silence/new?alertmanager=grafana&matchers=alertname%3DT2%2Cteam%3Dblue%2Czone%3Dus-1",
      "dashboardURL": "",
      "panelURL": "",
      "values": {
        "B": 44.23943737541908,
        "C": 1
      }
    },
    {
      "status": "firing",
      "labels": {
        "alertname": "High CPU usage",
        "team": "blue",
        "zone": "eu-1"
      },
      "annotations": {
        "description": "The system has high CPU usage",
        "runbook_url": "https://myrunbook.com/runbook/1234",
        "summary": "This alert was triggered for zone eu-1"
      },
      "startsAt": "2021-10-12T09:56:03.157076+02:00",
      "endsAt": "0001-01-01T00:00:00Z",
      "generatorURL": "https://play.grafana.org/alerting/d1rdpdv7k/edit",
      "fingerprint": "bc97ff14869b13e3",
      "silenceURL": "https://play.grafana.org/alerting/silence/new?alertmanager=grafana&matchers=alertname%3DT1%2Cteam%3Dblue%2Czone%3Deu-1",
      "dashboardURL": "",
      "panelURL": "",
      "values": {
        "B": 44.23943737541908,
        "C": 1
      }
    }
  ],
  "groupLabels": {},
  "commonLabels": {
    "team": "blue"
  },
  "commonAnnotations": {},
  "externalURL": "https://play.grafana.org/",
  "version": "1",
  "groupKey": "test-z7uoJoZ83dFLVgPe-eV5moHMhV7xN",
  "truncatedAlerts": 0,
  "title": "[FIRING:2]  (blue)",
  "state": "alerting",
  "message": "**Firing**\n\nLabels:\n - alertname = T2\n - team = blue\n - zone = us-1\nAnnotations:\n - description = This is the alert rule checking the second system\n - runbook_url = https://myrunbook.com\n - summary = This is my summary\nSource: https://play.grafana.org/alerting/1afz29v7z/edit\nSilence: https://play.grafana.org/alerting/silence/new?alertmanager=grafana&matchers=alertname%3DT2%2Cteam%3Dblue%2Czone%3Dus-1\n\nLabels:\n - alertname = T1\n - team = blue\n - zone = eu-1\nAnnotations:\nSource: https://play.grafana.org/alerting/d1rdpdv7k/edit\nSilence: https://play.grafana.org/alerting/silence/new?alertmanager=grafana&matchers=alertname%3DT1%2Cteam%3Dblue%2Czone%3Deu-1\n"
}
Will be transposed to the following FireHydrant Signal:
{
  "summary": "[FIRING:2]  (blue)",
  "body": "**Firing**\n\nLabels:\n - alertname = T2\n - team = blue\n - zone = us-1\nAnnotations:\n - description = This is the alert rule checking the second system\n - runbook_url = https://myrunbook.com\n - summary = This is my summary\nSource: https://play.grafana.org/alerting/1afz29v7z/edit\nSilence: https://play.grafana.org/alerting/silence/new?alertmanager=grafana&matchers=alertname%3DT2%2Cteam%3Dblue%2Czone%3Dus-1\n\nLabels:\n - alertname = T1\n - team = blue\n - zone = eu-1\nAnnotations:\nSource: https://play.grafana.org/alerting/d1rdpdv7k/edit\nSilence: https://play.grafana.org/alerting/silence/new?alertmanager=grafana&matchers=alertname%3DT1%2Cteam%3Dblue%2Czone%3Deu-1\n",
  "links": [
    {
      "href": "https://play.grafana.org/alerting/1afz29v7z/edit",
      "text": "High memory usage"
    },
    {
      "href": "https://play.grafana.org/alerting/d1rdpdv7k/edit",
      "text": "High CPU usage"
    }
  ],
  "images": [
    {
      "src": "null",
      "alt": "The system has high memory usage"
    },
    {
      "src": "null",
      "alt": "The system has high CPU usage"
    }
  ],
  "annotations": {
    "grafana/labels-team": "blue",
    "grafana/groupKey": "test-z7uoJoZ83dFLVgPe-eV5moHMhV7xN"
  },
  "idempotency_key": "test-z7uoJoZ83dFLVgPe-eV5moHMhV7xN",
  "status": 0
}
Updated 8 months ago
