Analytics Basics
Note:Analytics require Enterprise tier. By default, all
GAMEDAYandMAINTENANCEseverity incidents are excluded from analytics.
FireHydrant provides in-depth analytics so you can understand the health and state of your organization. The Analytics are split into the following subpages:
- Incidents and Impact - Statistics and metrics on incidents by components, severity, and more
- Resources and Tasks - Graphs and charts of Retrospectives, Tasks/Follow-Ups completion, and incidents by team
- Alerting Analytics - Statistics on alerts, acknowledgments, and incidents, as well as MTTA and MTTR. Groupable and filterable by components, teams, tags, and more
- Exporting Data - FireHydrant supports exporting data in a variety of ways, including via API and throughout multiple pages in the web interface
To read more about each of these, visit the corresponding pages for each section.
Quickstart

Filters at the top of each Analytics page
Filtering Data
FireHydrant allows filtering the data shown on the analytics pages so you can see the information you're interested in.
-
Grouped by - The MTTX analytics page has a grouping dropdown where you can lay out the data and group results according to specific entities. Some options include:
- Service - Impacted services on incidents
- Environment - Impacted environments on incidents
- Functionality - Impacted functionalities on incidents
- Team - Assigned Teams on incidents
- Severity - Severity of incidents
- User - Assigned users on incidents
- Custom Fields - Any custom fields created and managed by your organization
-
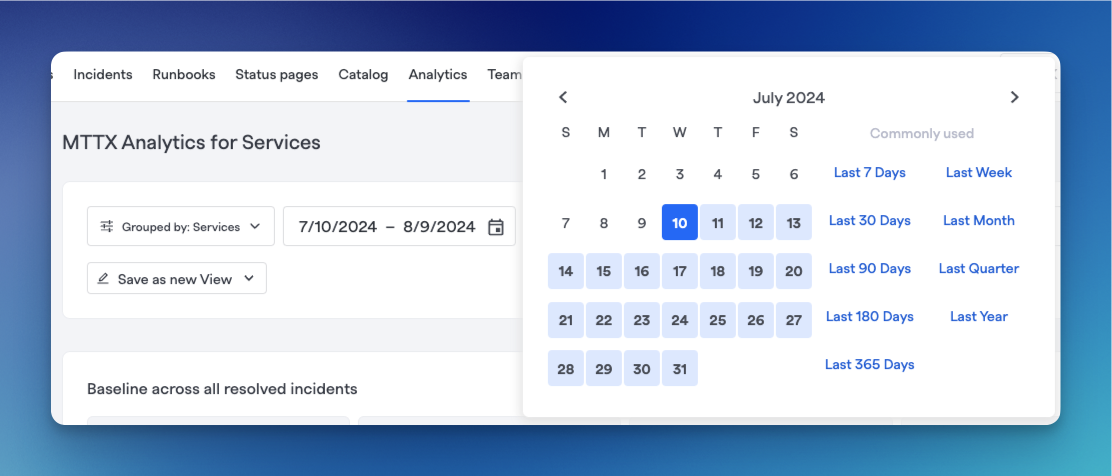
Select a date range - By default, the Date Range is set to the previous 30 days and filters in UTC timestamps. For example, if you select a date range of
03/20/2022 - 03/23/2022, we will pull data between03/20/2022 00:00:00 UTCand03/23/2022 23:59:59 UTC. There are also quick date ranges available such as Last 7 Days, Last Week, and various others.
Date range filter options on FireHydrant
-
Search query - Some pages allow for querying specific incidents by name
-
Choose a resolution - Some pages have a Resolution dropdown which defaults to weekly, but you can change it to daily or monthly if desired. This will largely depend on what date range you are looking at.
-
Display options - Some pages allow toggling between Grid format, which displays each chart in a grid two graphs wide, or List format, which shows all the charts in single-column format. Responsiveness settings will automatically convert the page to List format if your screen/window is not wide enough to reasonably display in a grid.
-
[Optional] Add some filters** Conditional filters can be used to refine the specificity of your query. You can apply multiple filters and also save them into Saved Views. For example, you can specify filters for specific Teams or Services and save them as custom views for said teams. FireHydrant supports the following filters:
- Core
- Severity - Filter for incidents of specified severity or severities
- Priority - Filter for incidents of specified priority or priorities
- Current milestone - Filter for incidents currently at specified milestone(s). This is only supported for some Analytics pages
- Incident Tags - Filter for incidents with the specified tag(s)
- Started after - Incidents whose Started milestone are on or after selected date
- Started before - Incidents whose Started milestone are on or before selected date
- Resolved after - Incidents whose Resolved milestone are on or after selected date
- Resolved before - Incidents whose Resolved milestone are on or before selected date
- Closed after - Incidents whose Closed milestone are on or after selected date
- Closed before - Incidents whose Closed milestone are on or before selected date
- Declared after - Incidents declared on or after selected date
- Declared before - Incidents declared on or before selected date
- Incident Labels - Filter for incidents with the specified label(s)
- Visibility (private or public) - Filter for private or public incidents
- Incident Type - Filter for incidents created from the specified incident type(s)
- Responders
- Service owning team - Filter for incidents where specified team(s) had a service or functionality impacted. These teams may or may not have been directly assigned to the incident
- Assigned team - Filter for incidents where specified team(s) were explicitly assigned
- Incident openers - Filter for incidents declared by specified person(s)
- Role assigned - Filter for incidents where specified user(s) was assigned to specified role(s)
- Role unassigned - Filter for incidents where specified user(s) were unassigned from specified role(s)
- Catalog
- Impacted services - Filter for incidents where specified service(s) were impacted
- Impacted functionalities - Filter for incidents where specified functionality/functionalities were impacted
- Impacted environments - Filter for incidents where specified environment(s) were impacted
- Ticketing
- Has tasks/follow-ups the given states - Filter for incidents where there are tasks and/or follow-ups in the specified state(s)
- [Custom Fields ] - Filter for incidents where your custom field(s) are the specified value(s), or filter for incidents where custom fields are empty (no value set)
- Other - Other miscellaneous filters
- Watched - Incidents that the user is specifically watching
- Archived - Incidents that have been archived
- Core
**Note:These filters are also available on your Incidents page to search and filter the list of incidents.
Exporting Graphs and CSV
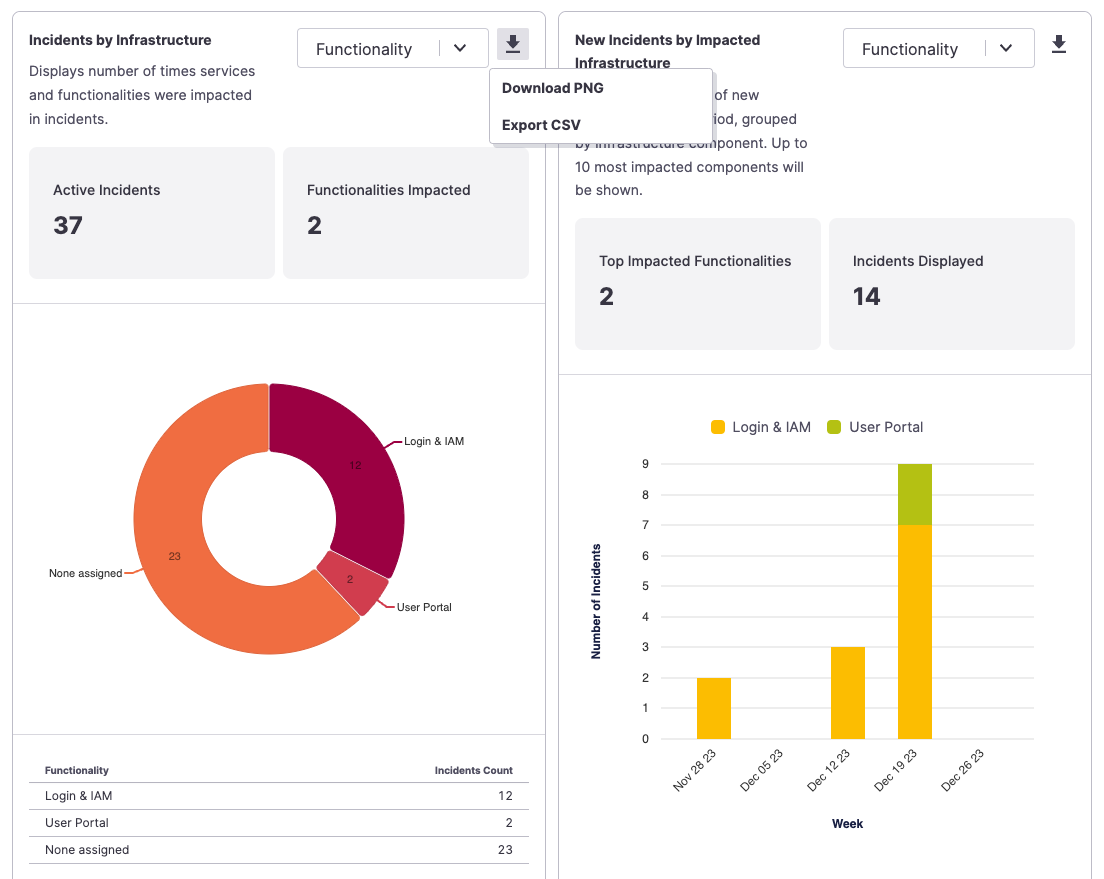
Once you've filtered the data you'd like to see, each chart has a download icon at the top right, allowing you to export the image to PNG or export the data via CSV.

Exporting a specific chart
Other pages, such as the MTTX Analytics page, will have CSV export capabilities for the data tables.
Active Incidents
The Incidents and Impact and Resources and Tasks subpages show statistics for all incidents that were active at any point within the time window. For example, if your time window is set to one day, an incident created more than a day ago but is still ongoing would be included in the metrics. This may be why the number of incidents Created is mismatched with the number Resolved.
The MTTX Analytics and Alerts subpages only count statistics for resolved incidents.
Private Incidents
Private Incidents will have their visibility and impact on Analytics determined by the specific user viewing the page. For example, if a user has Private permissions, they will see the full list of all incidents and impact in the analytics, (e.g., four public incidents and one private incident totaling 5).
But users with only Public permissions would not see the private incidents, so they'd only see statistics and metrics for four public incidents total.
Next Steps
- Browse each of the specific analytics subpages we offer:
- Incidents and Impact
- Resources and Tasks
- Alerting Analytics
- Exporting Data
- Other Analytics — including On-Call Hours, Service Catalog analytics, and Team-specific analytics
Updated 5 days ago
