Alert Visualization
Sometimes it's easier to see what an alert will do before it does it.
Setting up alerting can be a daunting task because you can feel like you're configuring in the unknown. For example, if an alert were to come in at 5pm on a Friday... who would it page? Which team(s) would respond? How many steps would there be?
We built our alert visualizer to help solve exactly that.
Pick an event
Signals are the name for FireHydrant's events that can be converted into an alert. When FireHydrant receives a signal, we search for rules that match the payload, or dispatch directly a team, escalation policy, or schedule. To use the visualizer effectively, we recommend having Signals already received and processed by FireHydrant.
Choose your event
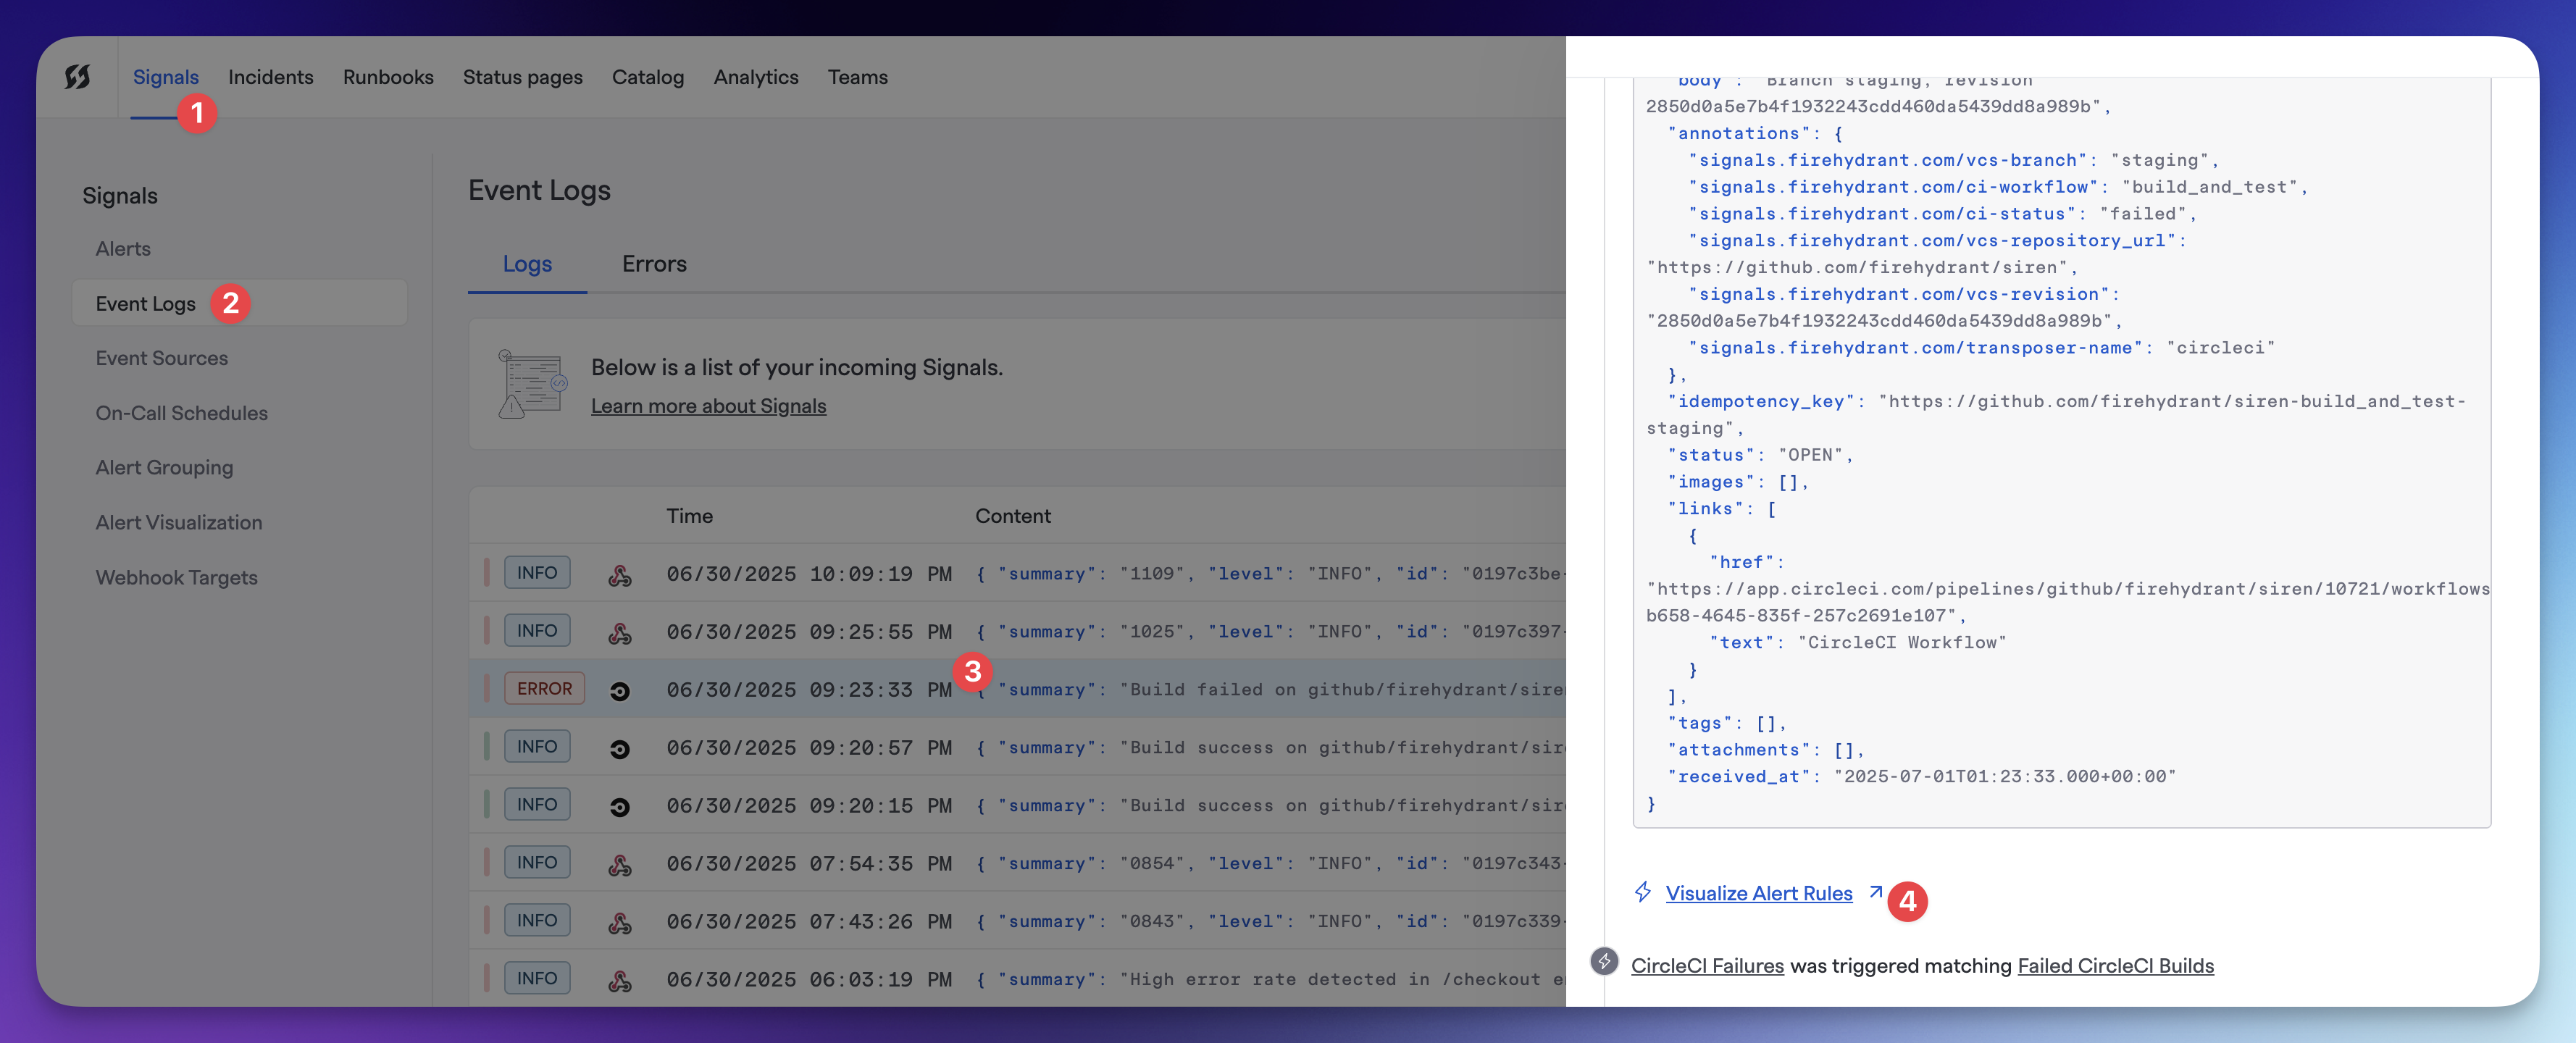
To visualize an existing alert, visit the "Signals" link in the navigation. Then click the "Event Logs" link in the left navigation. From there, click any of the Signals that FireHydrant has processed, scroll to the bottom of the drawer that appears, and click "Visualize Alert Rules"
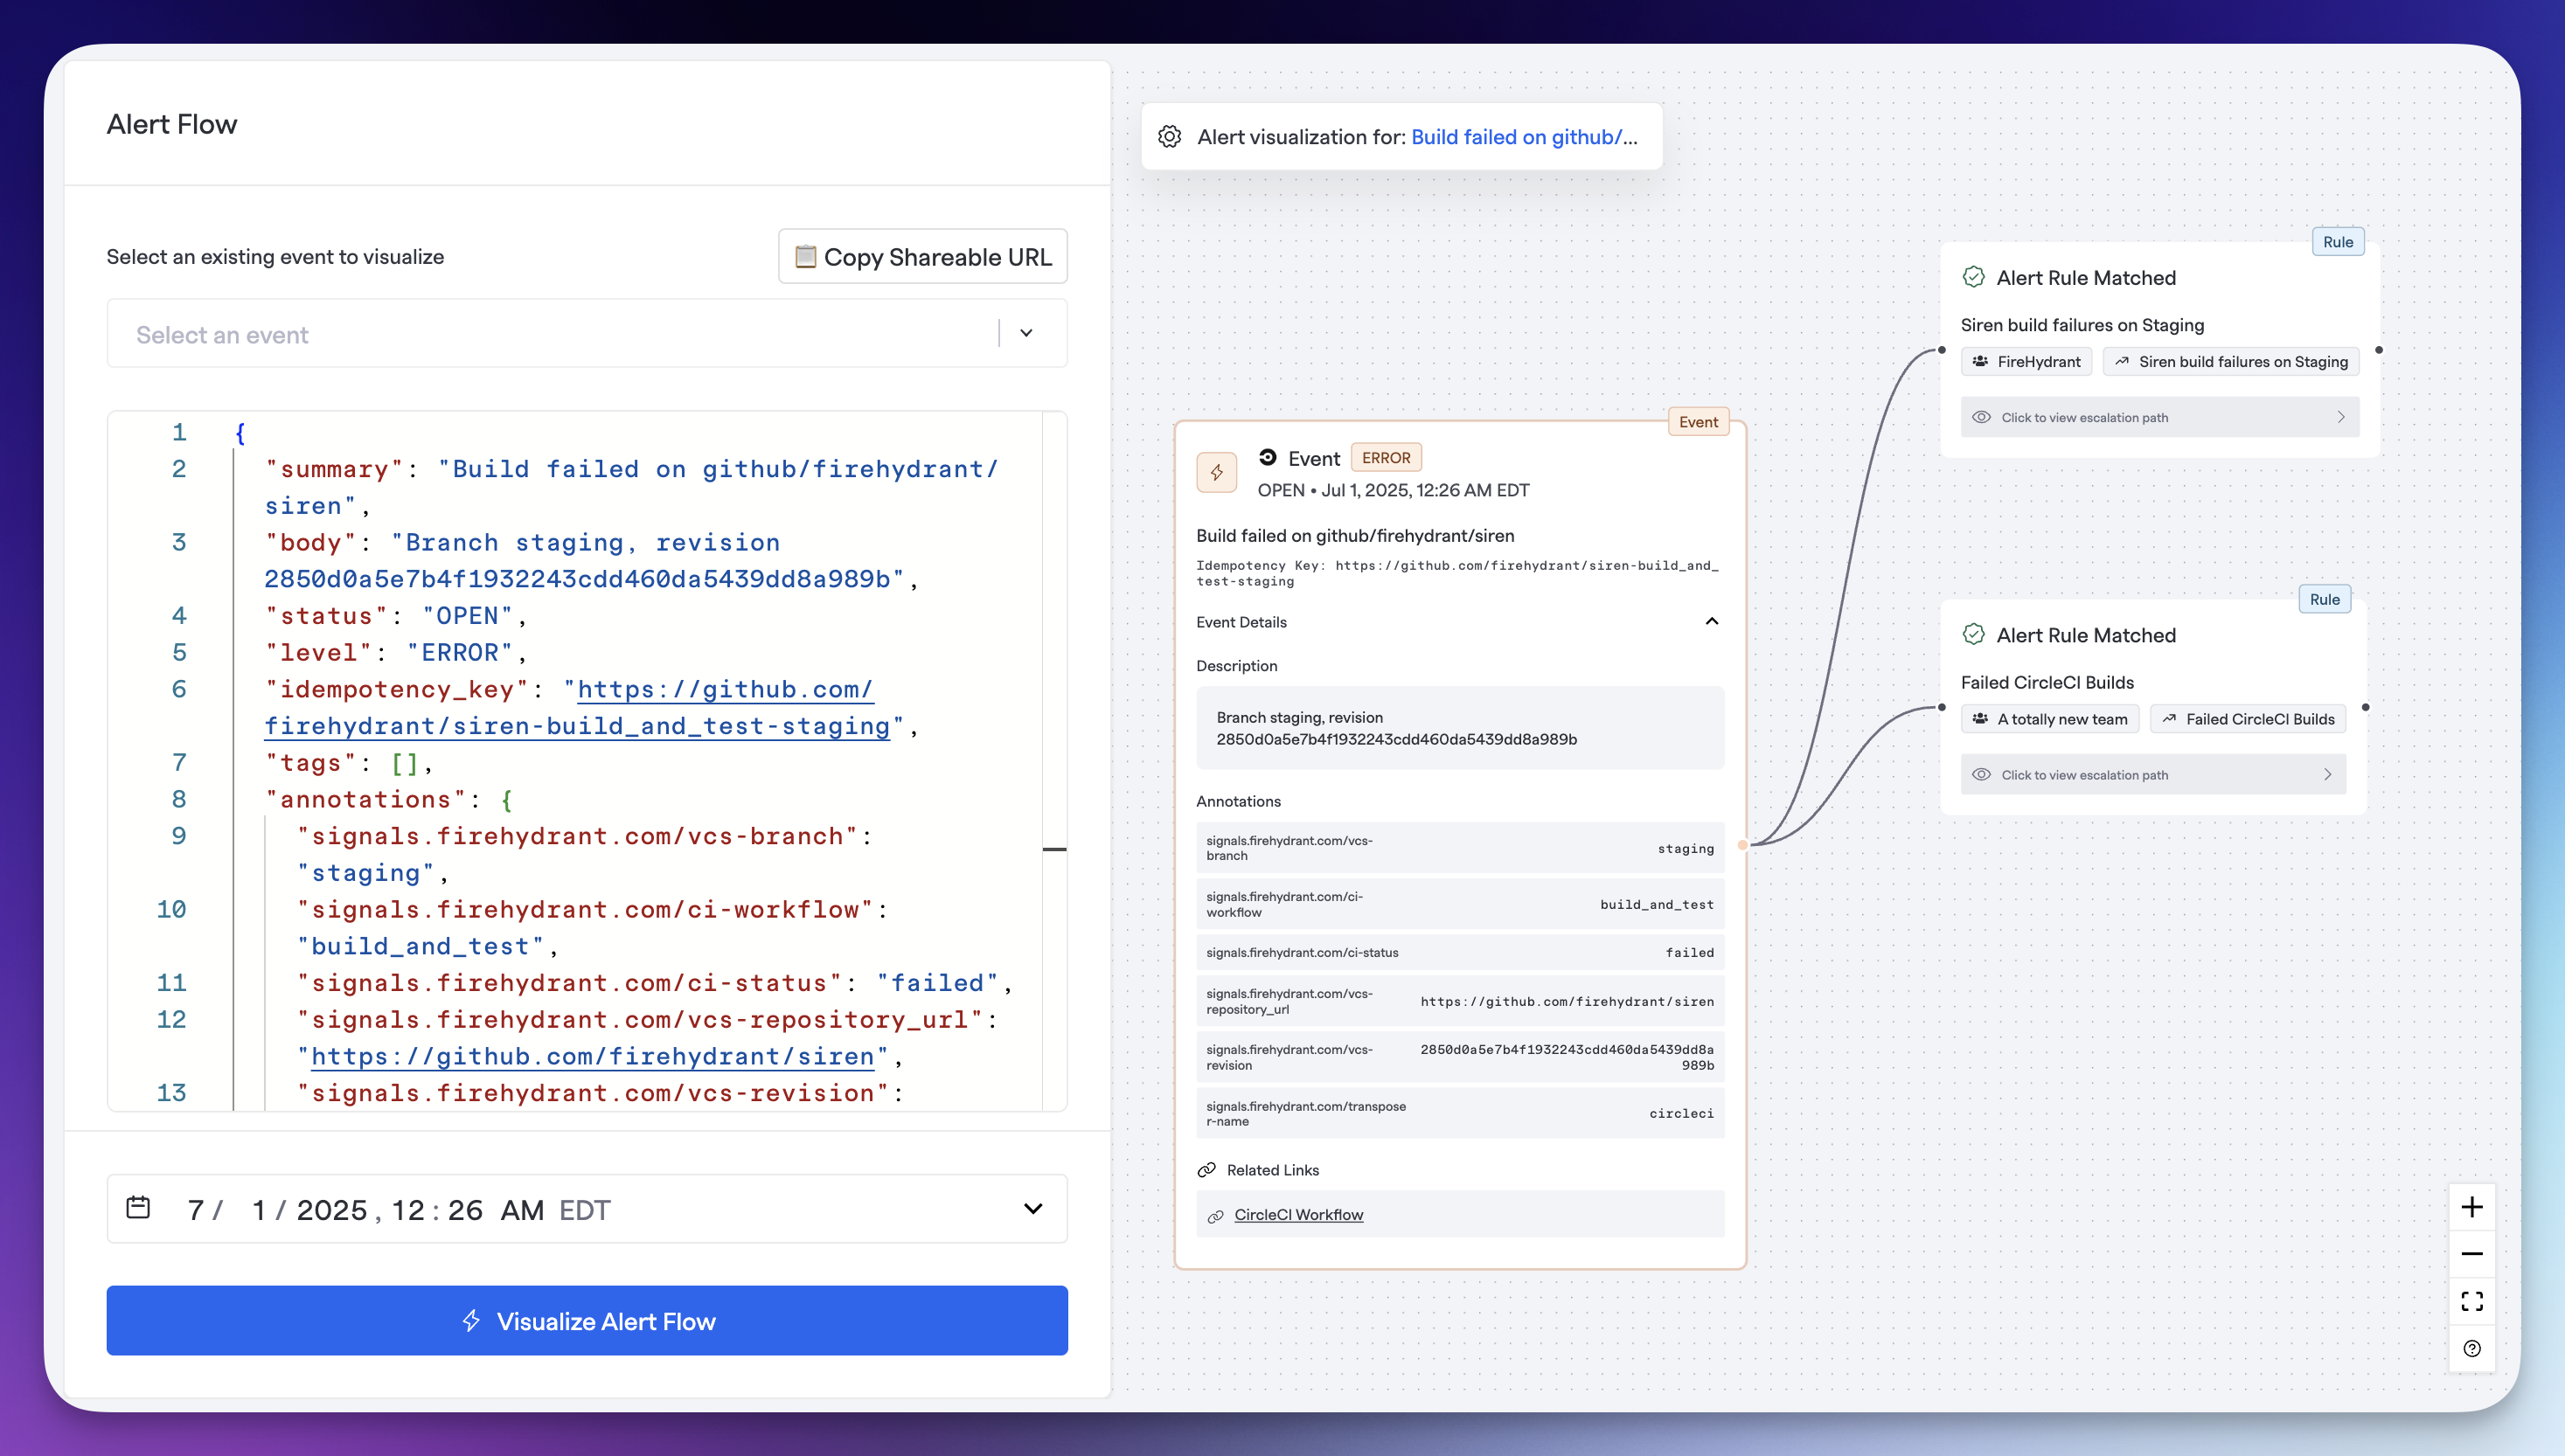
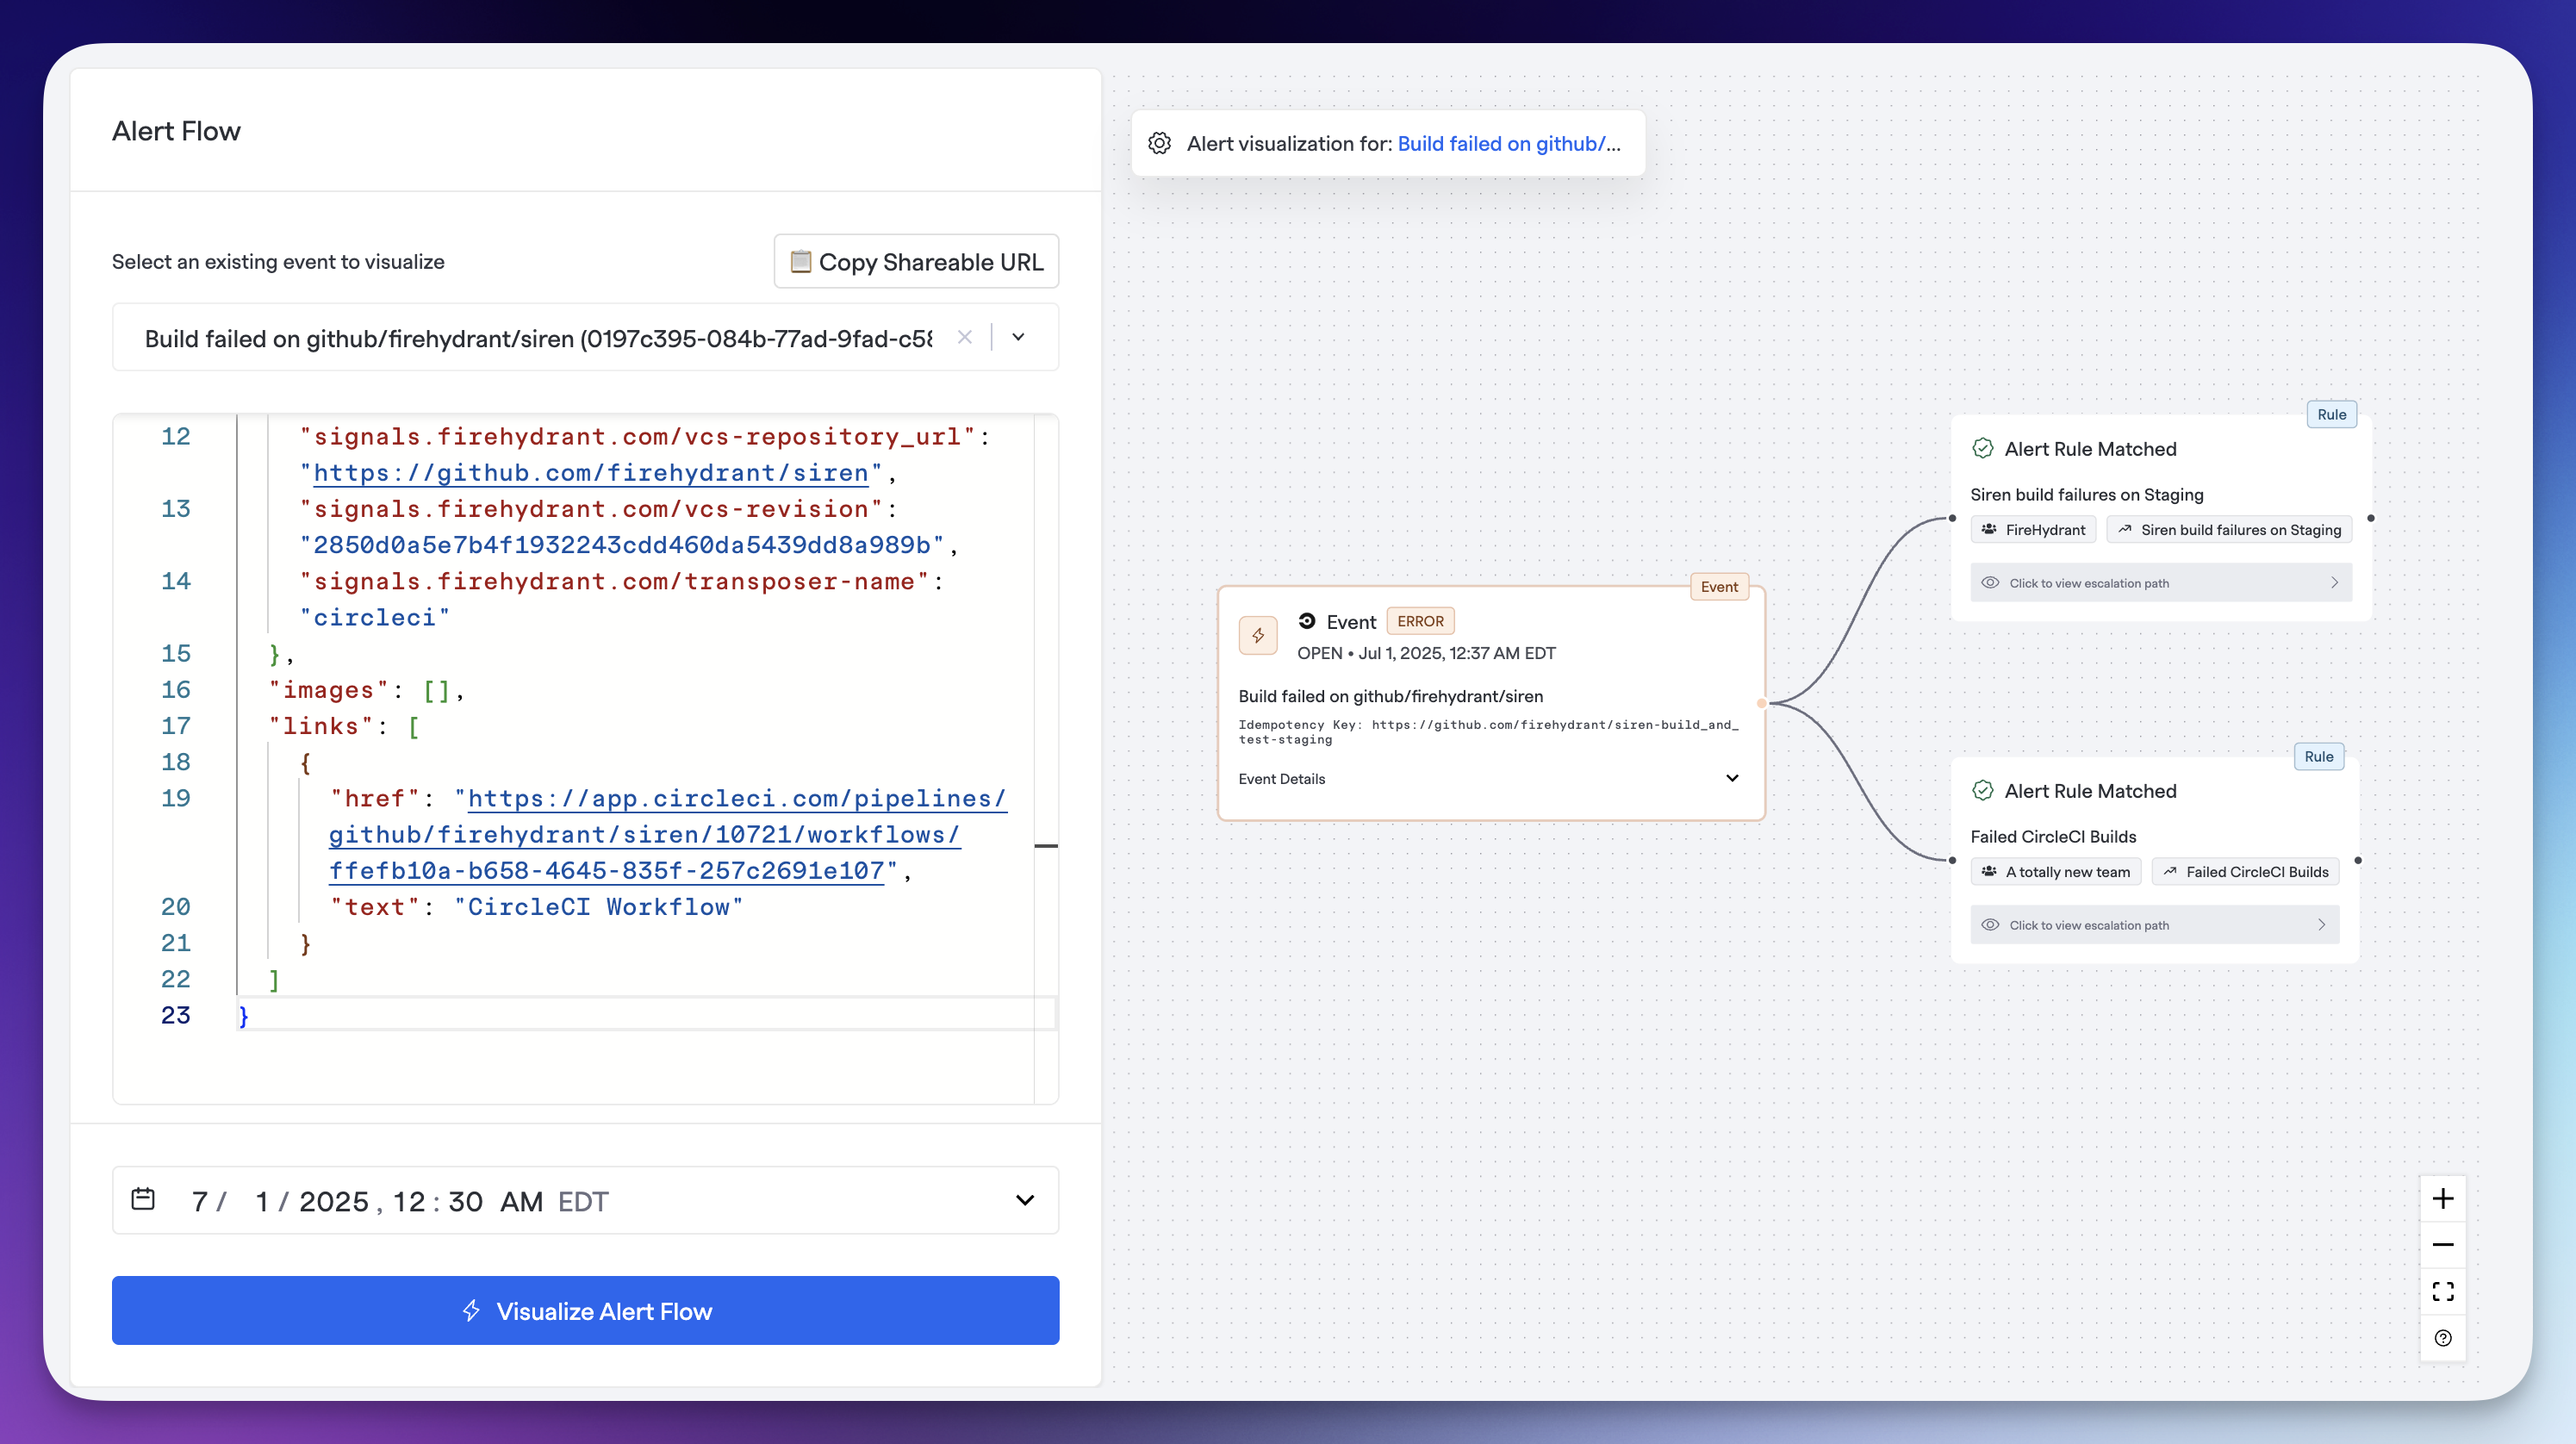
FireHydrant will render a DAG (directed acyclic graph) of your Signal's theoretical journey if it were to be received at the date and time selected. If multiple rules are matched, multiple paths will be presented.
Drilling down
To drill into a route, you can click on the initial target to see which steps the alert will take and when. This enables confidence that your configuration will target the right people, at the right time.
Alert Creation Attribution
When viewing alerts in the Signals list, timeline, or Slack notifications, you'll see attribution about who or what created the alert:
- Manually-paged alerts display the actor name (the user who paged the alert)
- Transposer-based alerts display the transposer name (the service or system that created the alert)
This helps responders understand the source and origin of each alert at a glance.
Updated 4 months ago