Data Export (deprecated)
Deprecation Notice
This feature is deprecated and scheduled for eventual removal. We encourage users who need to export data to use FireHydrant's API, built-in CSV exports in the web interface, and Webhooks.
FireHydrant offers data export capabilities alongside built-in metrics for your incident data. In addition to exporting data from specific pages and charts, there is a dedicated Data Export subpage within Analytics where you can configure filters and batch export data to CSV.
Once generated, links to the generated CSV files will be emailed directly to you and available for seven days before expiring and requiring a re-export.
Note:
Like other FireHydrant Analytics, the data export omits all
GAMEDAYandMAINTENANCEseverity incidents.
Quickstart
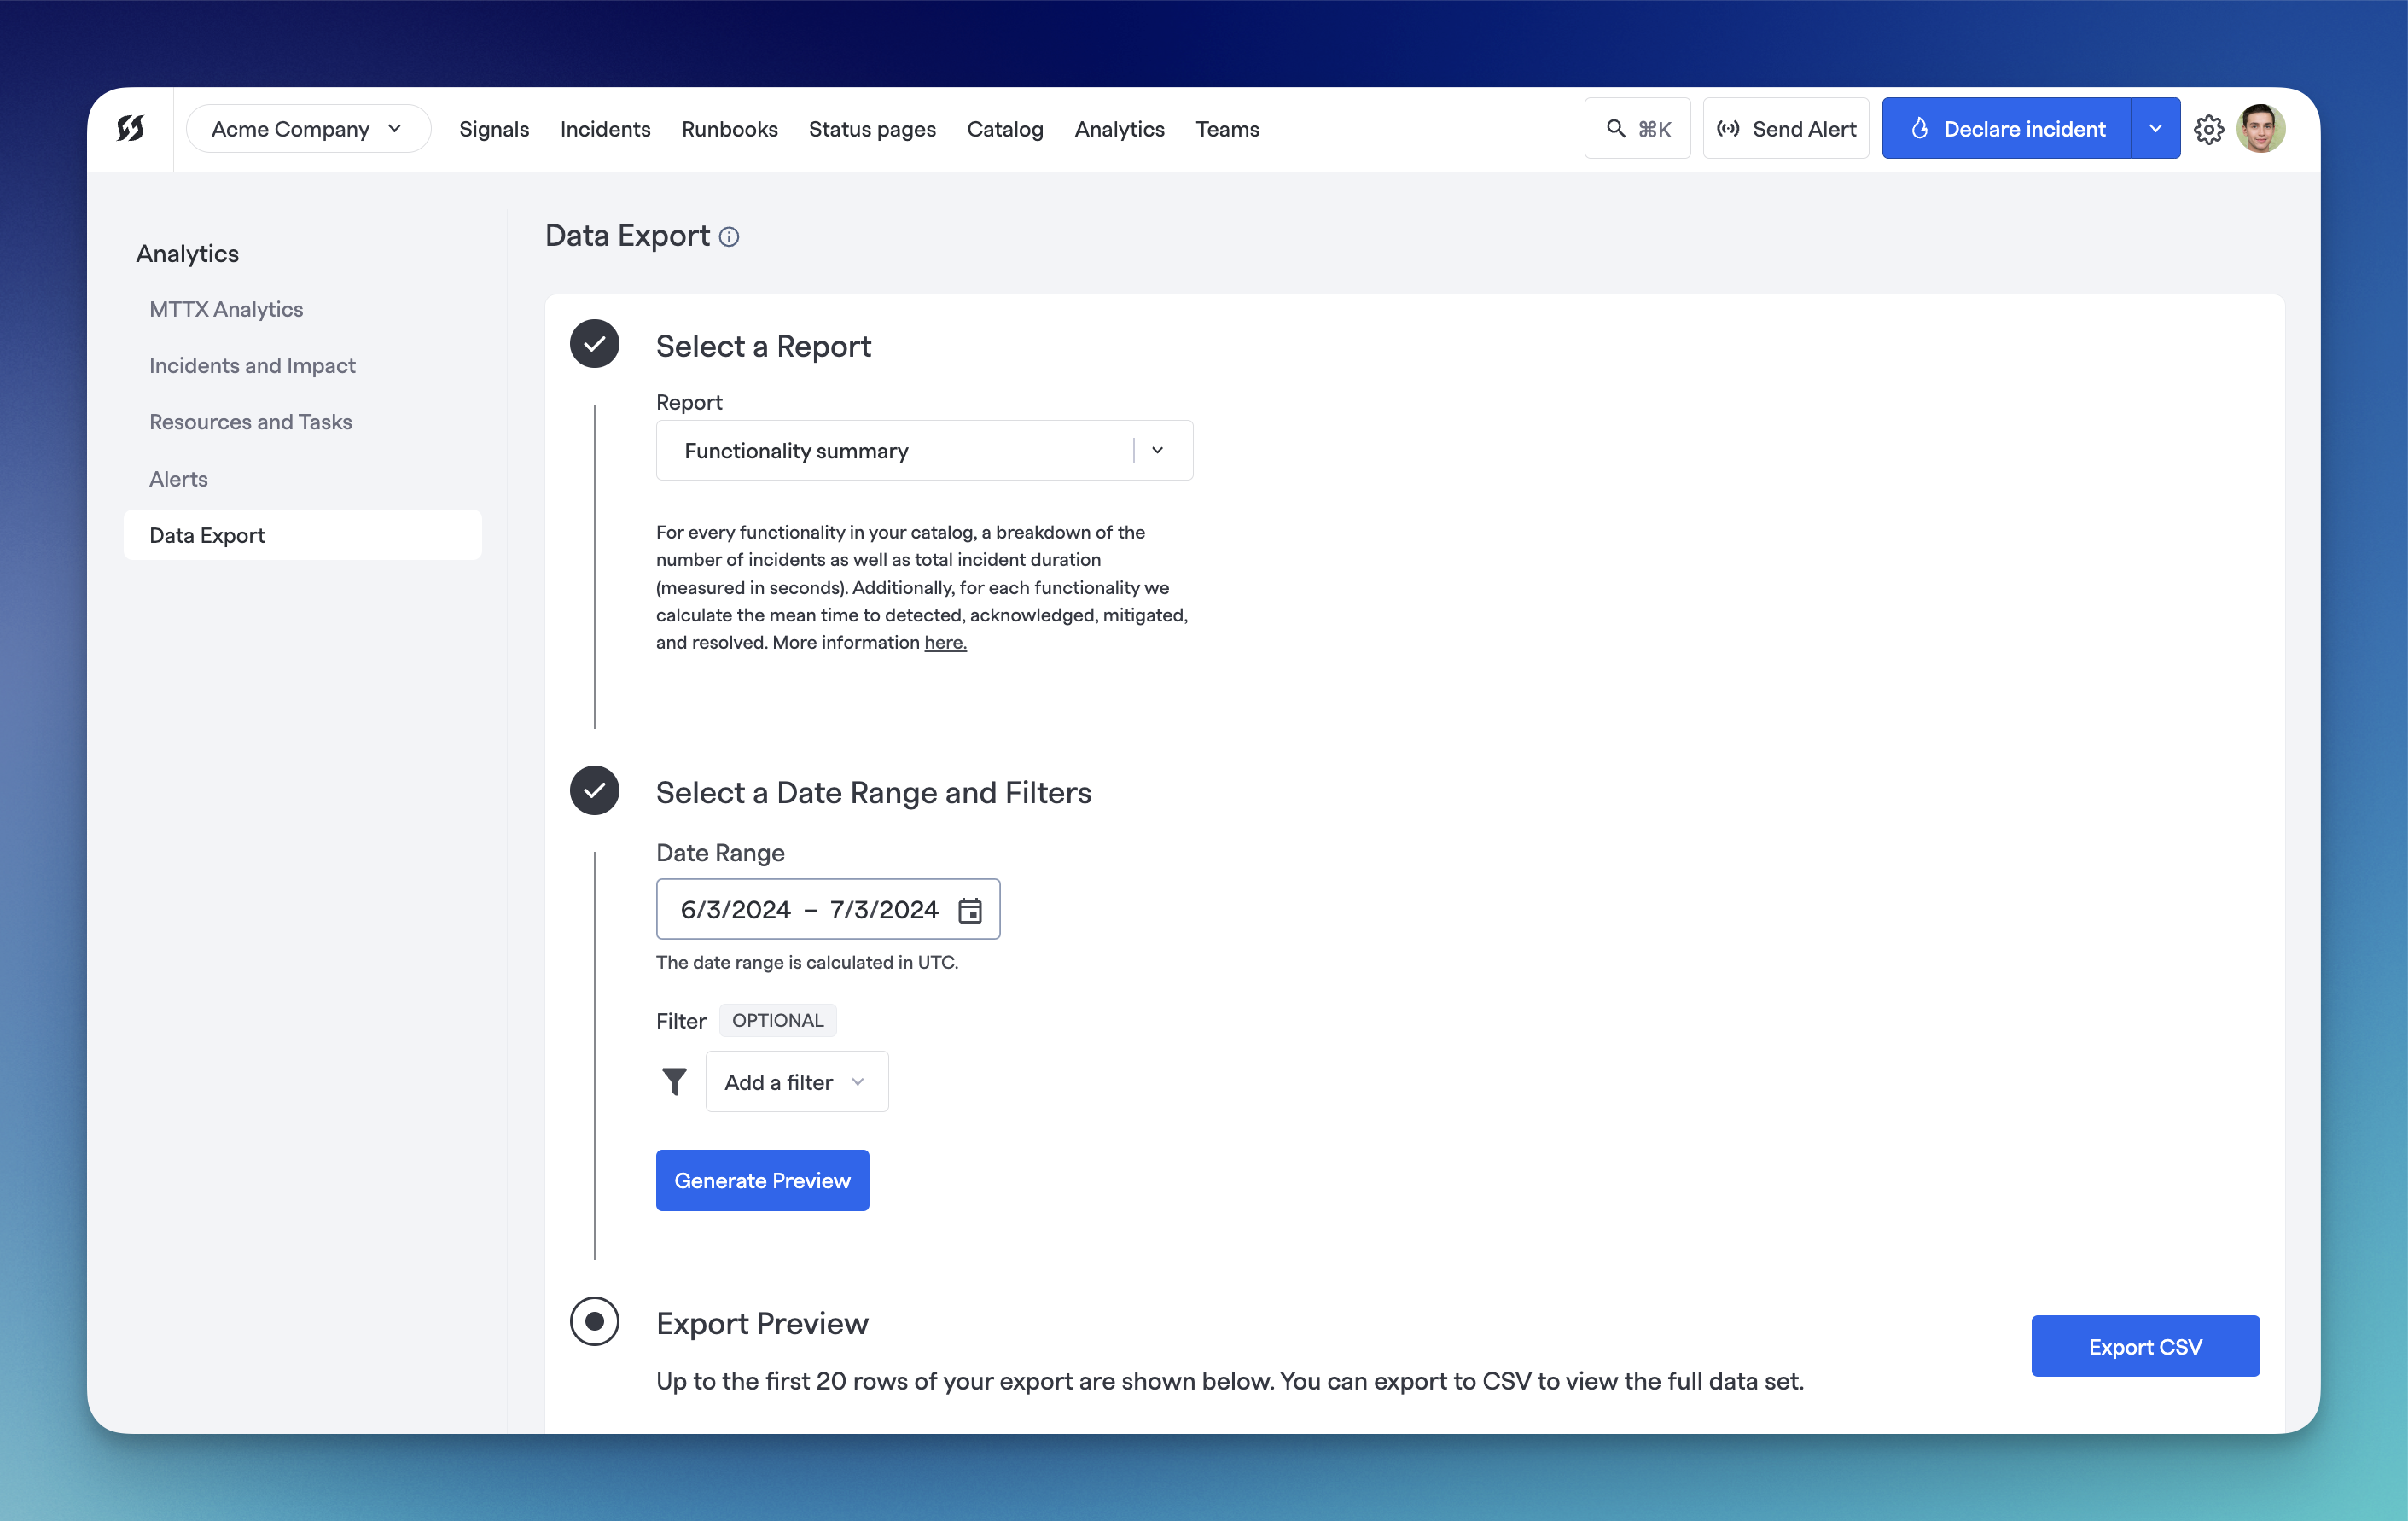
The Analytics > Data Export page
- Navigate to Analytics > Data Export. On this page, you will have a few fields you can configure:
- Select a report - Choose from various summary reports or chart data exports from the drop-down menu.
- Select a date range - Select the range of dates from which you'd like data. Keep in mind the date range currently defaults to UTC timestamps.
- Configure filters (optional) - In the same section as the data range picker, you can optionally select filters to further pare down data.
- Generate a Preview (optional) - You can generate a preview of the first 20 rows of export data to confirm you're getting the right information desired.
- Export CSV - Once you've confirmed your data, you can export the CSV. This process happens asynchronously in the background, so you are free to navigate away from this page and resume other activities. Once the file is ready, you'll be notified via email and provided a direct link to your file. If there were any errors in running your report, you will be notified with either an in-app message or email, depending on what went wrong.
If you’re still looking for a way to automate this, look at the CSV Data Export
Detailed Data Export Explanations
Service Summary
How are all of your services performing? Key indicators, such as incident count and mean time metrics, give your business insight into your organization's service performance and can be a meaningful report for technical and product leads.
Data Dictionary
| Column Name | Measurement Unit | Value Type | Description |
|---|---|---|---|
| Name | n/a | string | Service name as entered into service catalog by the user |
| Start Date | YYYY-MM-DD hh:mm:ss UTC | datetime | Start date selected as query parameter |
| End Date | YYYY-MM-DD hh:mm:ss UTC | datetime | End date selected as query parameter |
| Number of Incidents | Incident count | int | Count of new incidents created for the service during the specified date range |
| Total Incident Duration | seconds | int | Total duration of incident measured with incident start timestamp and resolved milestone timestamp; this will be blank if no incidents have been created during the date range |
| MTTD | seconds | int | Mean time to Detected metric for incidents created during the specified date range; calculated with incident start timestamp and detected milestone timestamp |
| MTTA | seconds | int | Mean time to Acknowledged metric for incidents created during the specified date range; calculated with incident start timestamp and acknowledged milestone timestamp |
| MTTM | seconds | int | Mean time to Mitigated metric for incidents created during the specified date range; calculated with incident start timestamp and mitigated milestone timestamp |
| MTTR | seconds | int | Mean time to Resolved metric for incidents created during the specified date range; calculated with incident start timestamp and resolved milestone timestamp |
Functionality Summary
How are all of your functionalities performing? Key indicators, such as incident count and mean time metrics, give your business insight into your organization's functionalities performance and can be a meaningful report for technical and product leads.
Data Dictionary
| Column Name | Measurement Unit | Value Type | Description |
|---|---|---|---|
| Name | n/a | string | Functionality name as entered into service catalog by the user |
| Start Date | YYYY-MM-DD hh:mm:ss UTC | datetime | Start date selected as query parameter |
| End Date | YYYY-MM-DD hh:mm:ss UTC | datetime | End date selected as query parameter |
| Number of Incidents | Incident count | int | Count of new incidents created for the functionality during the specified date range |
| Total Incident Duration | seconds | int | Total duration of incident measured with incident start timestamp and resolved milestone timestamp; this will be blank if no incidents have been created during the date range |
| MTTD | seconds | int | Mean time to Detected metric for incidents created during the specified date range; calculated with incident start timestamp and detected milestone timestamp |
| MTTA | seconds | int | Mean time to Acknowledged metric for incidents created during the specified date range; calculated with incident start timestamp and acknowledged milestone timestamp |
| MTTM | seconds | int | Mean time to Mitigated metric for incidents created during the specified date range; calculated with incident start timestamp and mitigated milestone timestamp |
| MTTR | seconds | int | Mean time to Resolved metric for incidents created during the specified date range; calculated with incident start timestamp and resolved milestone timestamp |
Responder Summary
Who is spending their time in incidents? Key indicators, such as incident count and duration, give your business insight into who is jumping into incidents to help manage individual burnout and identify potential single points of failure in our people.
Data Dictionary
| Column Name | Measurement Unit | Value Type | Description |
|---|---|---|---|
| Responder Name | n/a | string | Name of the Responder (Users) in your organization; not currently limited to a Role |
| Start Date | YYYY-MM-DD hh:mm:ss UTC | datetime | Start date selected as query parameter |
| End Date | YYYY-MM-DD hh:mm:ss UTC | datetime | End date selected as query parameter |
| Number of Incidents | Incident count | int | Count of new incidents created for the service during the specified date range |
| Total Incident Duration | seconds | int | Total duration of incident measured with incident start timestamp and resolved milestone timestamp; this will be blank if the Responder had not been assigned to any incidents created during the date range |
Severity Summary
How do your operations vary based on Incident Severity? Key indicators, such as incident count and mean time metrics, give your business insight into your organization's incident response processes.
Data Dictionary
| Column Name | Measurement Unit | Value Type | Description |
|---|---|---|---|
| Name | n/a | string | Severity name as entered into Severities set up by the user |
| Start Date | YYYY-MM-DD hh:mm:ss UTC | datetime | start date selected as query parameter |
| End Date | YYYY-MM-DD hh:mm:ss UTC | datetime | End date selected as query parameter |
| Number of Incidents | Incident count | int | Count of new incidents created with the given Severity during the specified date range |
| Total Incident Duration | seconds | int | Total duration of incident measured with incident start timestamp and resolved milestone timestamp; this will be blank if no incidents with specified severity were created during the date range |
| MTTD | seconds | int | Mean time to Detected metric for incidents created during the specified date range; calculated with incident start timestamp and detected milestone timestamp |
| MTTA | seconds | int | Mean time to Acknowledged metric for incidents created during the specified date range; calculated with incident start timestamp and acknowledged milestone timestamp |
| MTTM | seconds | int | Mean time to Mitigated metric for incidents created during the specified date range; calculated with incident start timestamp and mitigated milestone timestamp |
| MTTR | seconds | int | Mean time to Resolved metric for incidents created during the specified date range; calculated with incident start timestamp and resolved milestone timestamp |
Incident Summary
What is your overall incident performance? Key indicators, such as incident count and mean time metrics, give your business insight into your organization’s health and can be a meaningful report for technical and product leads.
Data Dictionary
| Column Name | Measurement Unit | Value Type | Description |
|---|---|---|---|
| Start Date | YYYY-MM-DD hh:mm:ss UTC | datetime | start date selected as query parameter |
| End Date | YYYY-MM-DD hh:mm:ss UTC | datetime | End date selected as query parameter |
| Number of Open Incidents | Incident count | int | Count of incidents that were in milestones detected through mitigated during the selected date range |
| Number of Resolved Incidents | Incident count | int | Count of incidents that moved into the resolved milestone status during the selected date range |
| MTTD | seconds | int | Mean time to Detected metric for incidents created during the specified date range; calculated with incident start timestamp and detected milestone timestamp |
| MTTA | seconds | int | Mean time to Acknowledged metric for incidents created during the specified date range; calculated with incident start timestamp and acknowledged milestone timestamp |
| MTTM | seconds | int | Mean time to Mitigated metric for incidents created during the specified date range; calculated with incident start timestamp and mitigated milestone timestamp |
| MTTR | seconds | int | Mean time to Resolved metric for incidents created during the specified date range; calculated with incident start timestamp and resolved milestone timestamp |
Incident Resolution
Number of retrospectives started and completed in comparison with the total number of resolved incidents.
Data Dictionary
| Column Name | Measurement Unit | Value Type | Description |
|---|---|---|---|
| Start Date | YYYY-MM-DD hh:mm:ss UTC | datetime | Start date of range to query for data |
| End Date | YYYY-MM-DD hh:mm:ss UTC | datetime | End date of range to query for data |
| Created Incidents | Incident count | int | Count of incidents started within the time window |
| Resolved Incidents | Incident count | int | Count of incidents resolved within the time window |
Retrospective Completion
Incidents created vs. resolved within the time window
Data Dictionary
| Column Name | Measurement Unit | Value Type | Description |
|---|---|---|---|
| Start Date | YYYY-MM-DD hh:mm:ss UTC | datetime | Start date of range to query for data |
| End Date | YYYY-MM-DD hh:mm:ss UTC | datetime | End date of range to query for data |
| Resolved Incidents | Incident count | int | Count of incidents resolved within the time window |
| Retrospectives started | count | int | Count of incidents a retrospective was started for |
| Retrospectives completed | count | int | Count of incidents a retrospective was completed for |
Task Completion
Tasks created vs. completed in all incidents within the time window
Data Dictionary
| Column Name | Measurement Unit | Value Type | Description |
|---|---|---|---|
| Start Date | YYYY-MM-DD hh:mm:ss UTC | datetime | Start date of range to query for data |
| End Date | YYYY-MM-DD hh:mm:ss UTC | datetime | End date of range to query for data |
| Tasks created | count | int | Count of tasks created across all incidents within the time window |
| Tasks completed | count | int | Count of tasks completed across all incidents within the time window |
Follow-up Completion
Follow-up created vs. completed in all incidents within the time window
Data Dictionary
| Column Name | Measurement Unit | Value Type | Description |
|---|---|---|---|
| Start Date | YYYY-MM-DD hh:mm:ss UTC | datetime | Start date of range to query for data |
| End Date | YYYY-MM-DD hh:mm:ss UTC | datetime | End date of range to query for data |
| Follow ups created | count | int | Count of follow-ups created across all incidents within the time window |
| Follow ups completed | count | int | Count of follow-ups completed across all incidents within the time window |
Active Incidents by Team
Count of incidents that were active (not resolved) at any point within the time window.
Data Dictionary
| Column Name | Measurement Unit | Value Type | Description |
|---|---|---|---|
| Start Date | YYYY-MM-DD hh:mm:ss UTC | datetime | Start date of range to query for data |
| End Date | YYYY-MM-DD hh:mm:ss UTC | datetime | End date of range to query for data |
| Team Name | string | int | Name of the team |
| Active Incidents | count | int | Count of incidents that were in an unresolved stated at any point within the time window |
Mean Time to Milestone for Active Incidents
The MTT* metrics for all incidents that were active within the specified time window.
Data Dictionary
| Column Name | Measurement Unit | Value Type | Description |
|---|---|---|---|
| Start Date | YYYY-MM-DD hh:mm:ss UTC | datetime | Start date of range to query for data |
| End Date | YYYY-MM-DD hh:mm:ss UTC | datetime | End date of range to query for data |
| MTTD | seconds | int | Mean time to Detected metric for incidents created during the specified date range; calculated with incident start timestamp and detected milestone timestamp |
| MTTA | seconds | int | Mean time to Acknowledged metric for incidents created during the specified date range; calculated with incident start timestamp and acknowledged milestone timestamp |
| MTTM | seconds | int | Mean time to Mitigated metric for incidents created during the specified date range; calculated with incident start timestamp and mitigated milestone timestamp |
| MTTR | seconds | int | Mean time to Resolved metric for incidents created during the specified date range; calculated with incident start timestamp and resolved milestone timestamp |
Updated 5 months ago